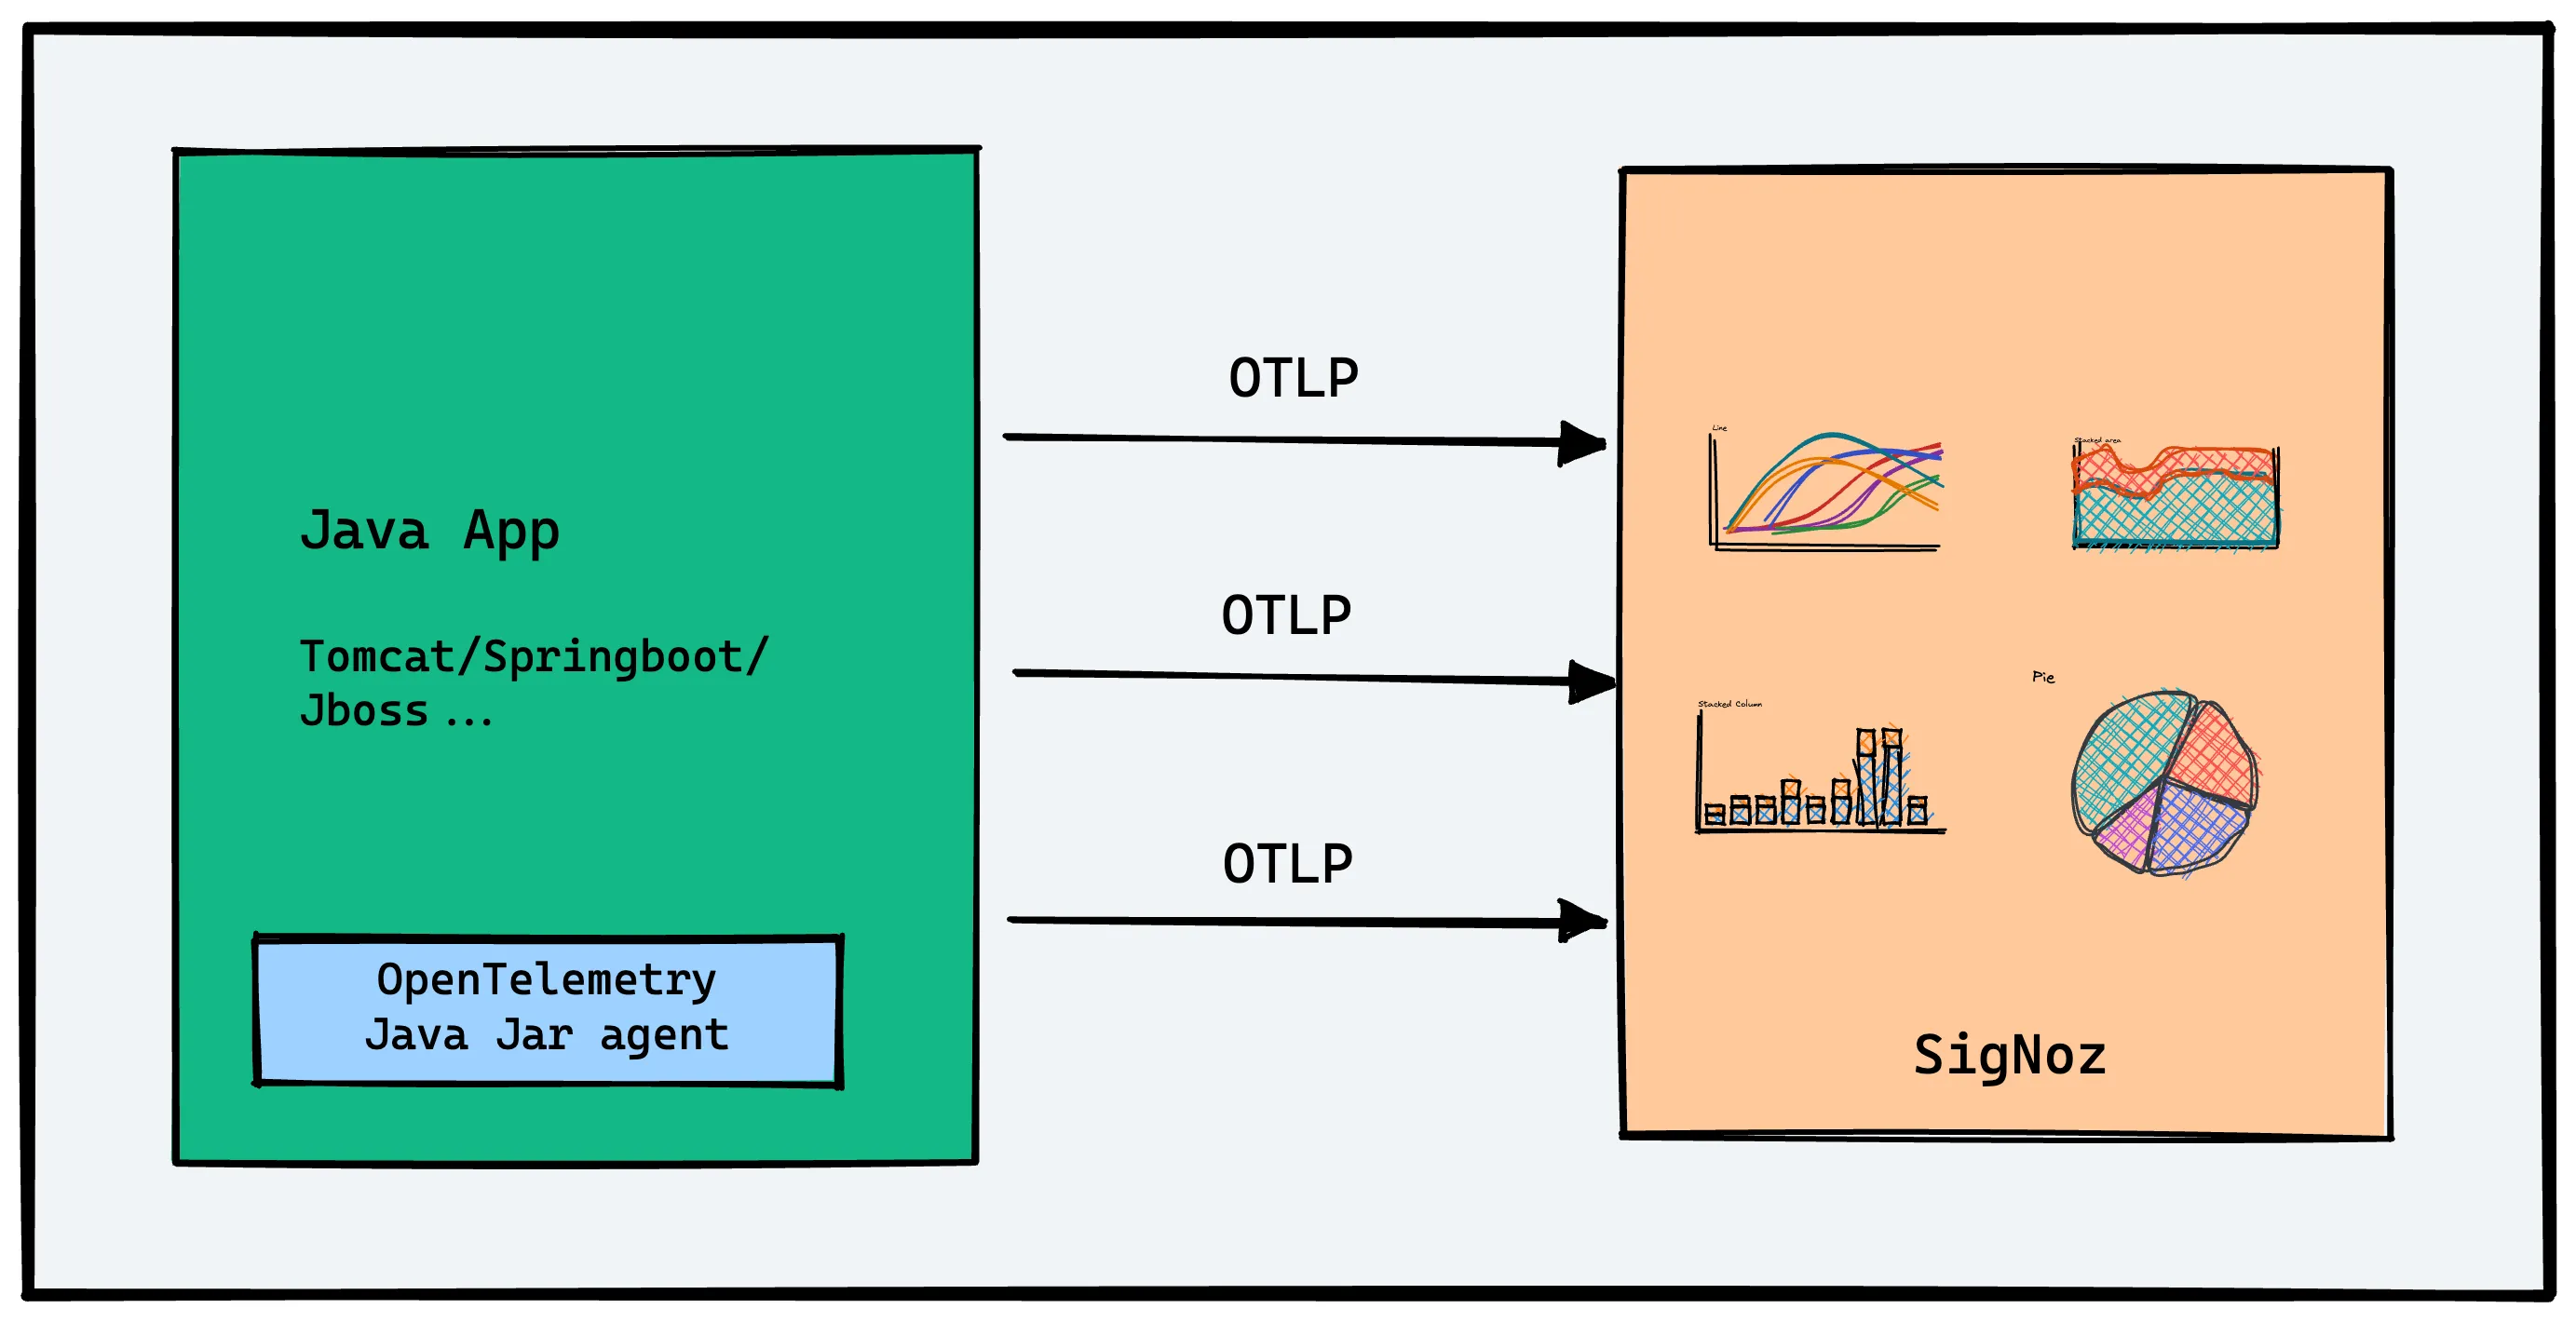
Java OpenTelemetry Instrumentation
OpenTelemetry, also known as OTel for short, is an open source observability framework that can help you generate and collect telemetry data - traces, metrics, and logs from your Java application.
OpenTelemetry Java is the language-specific implementation of OpenTelemetry in Java.

Requirements
Java 8 or higher
Send Traces to SigNoz Cloud
OpenTelemetry provides a handy Java JAR agent that can be attached to any Java 8+ application and dynamically injects bytecode to capture telemetry from a number of popular libraries and frameworks.
Based on your application environment, you can choose the setup below to send traces to SigNoz Cloud.
From VMs, there are two ways to send data to SigNoz Cloud.
Send traces directly to SigNoz Cloud
OpenTelemetry Java agent can send traces directly to SigNoz Cloud.
Step 1. Download otel java binary agent
wget https://github.com/open-telemetry/opentelemetry-java-instrumentation/releases/latest/download/opentelemetry-javaagent.jar
Step 2. Run your application
OTEL_RESOURCE_ATTRIBUTES=service.name=<app_name> \
OTEL_EXPORTER_OTLP_HEADERS="signoz-ingestion-key=SIGNOZ_INGESTION_KEY" \
OTEL_EXPORTER_OTLP_ENDPOINT=https://ingest.{region}.signoz.cloud:443 \
java -javaagent:$PWD/opentelemetry-javaagent.jar -jar <my-app>.jar
<app_name>is the name for your applicationSIGNOZ_INGESTION_KEYis the API token provided by SigNoz. You can find your ingestion key from SigNoz cloud account details sent on your email.
Depending on the choice of your region for SigNoz cloud, the ingest endpoint will vary according to this table.
| Region | Endpoint |
|---|---|
| US | ingest.us.signoz.cloud:443 |
| IN | ingest.in.signoz.cloud:443 |
| EU | ingest.eu.signoz.cloud:443 |
In case you encounter an issue where all applications do not get listed in the services section then please refer to the troubleshooting section.
Send traces via OTel Collector binary
Step 1. Download OTel java binary agent
wget https://github.com/open-telemetry/opentelemetry-java-instrumentation/releases/latest/download/opentelemetry-javaagent.jar
Step 2. Run your application
java -javaagent:$PWD/opentelemetry-javaagent.jar -jar <myapp>.jar
<myapp>is the name of your application jar file- In case you download
opentelemetry-javaagent.jarfile in different directory than that of the project, replace$PWDwith the path of the otel jar file.
In case you encounter an issue where all applications do not get listed in the services section then please refer to the troubleshooting section.
Validating instrumentation by checking for traces
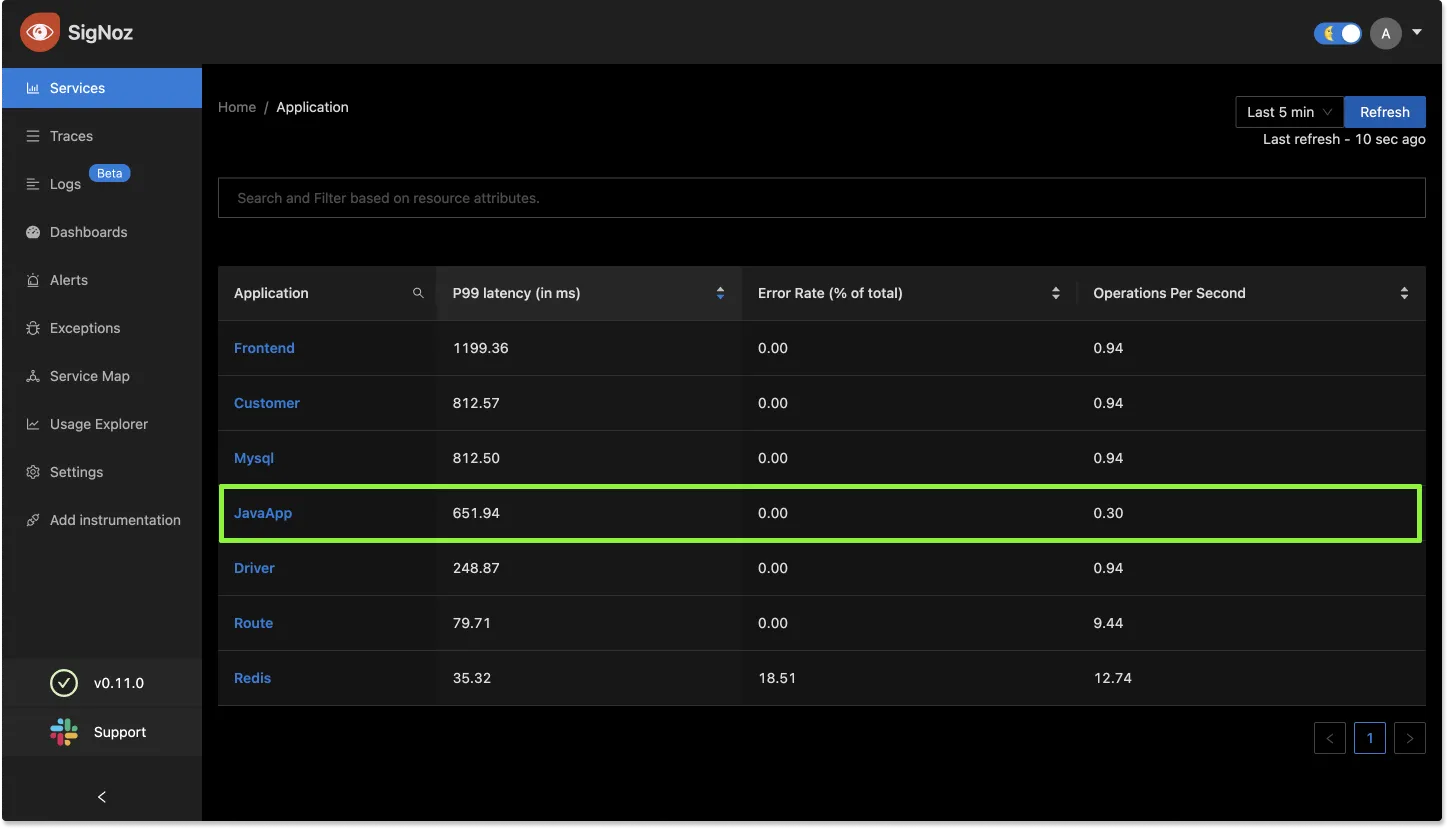
With your application running, you can verify that you’ve instrumented your application with OpenTelemetry correctly by confirming that tracing data is being reported to SigNoz.
To do this, you need to ensure that your application generates some data. Applications will not produce traces unless they are being interacted with, and OpenTelemetry will often buffer data before sending. So you need to interact with your application and wait for some time to see your tracing data in SigNoz.
Validate your traces in SigNoz:
- Trigger an action in your app that generates a web request. Hit the endpoint a number of times to generate some data. Then, wait for some time.
- In SigNoz, open the
Servicestab. Hit theRefreshbutton on the top right corner, and your application should appear in the list ofApplications. Ensure that you're checking data for thetime range filterapplied in the top right corner. - Go to the
Tracestab, and apply relevant filters to see your application’s traces.
You might see other dummy applications if you’re using self-hosted SigNoz for the first time. You can remove it by following the docs here.

If you don't see your application reported in the list of services, try our troubleshooting guide.
Configuring the agent
The agent is highly configurable. You can check out all the configuration options available here.
Disabled instrumentations
Some instrumentations can produce too many spans and make traces very noisy. For this reason, the following instrumentations are disabled by default:
jdbc-datasourcewhich creates spans whenever thejava.sql.DataSource#getConnectionmethod is called.dropwizard-metrics, which might create very low-quality metrics data because of the lack of label/attribute support in the Dropwizard metrics API.
To enable them, add the otel.instrumentation.<name>.enabled system property: -Dotel.instrumentation.jdbc-datasource.enabled=true
Manual Instrumentation
For manual instrumentation of Java application, refer to the docs here.
Sample Java Application
- We have included a sample Java application with README.md at Sample Java App Github Repo.
Frequently Asked Questions
How to find what to use in
IP of SigNozif I have installed SigNoz in Kubernetes cluster?Based on where you have installed your application and where you have installed SigNoz, you need to find the right value for this. Please use this grid to find the value you should use for
IP of SigNozI am sending data from my application to SigNoz, but I don't see any events or graphs in the SigNoz dashboard. What should I do?
This could be because of one of the following reasons:
Your application is generating telemetry data, but not able to connect with SigNoz installation
Please use this troubleshooting guide to find if your application is able to access SigNoz installation and send data to it.
Your application is not actually generating telemetry data
Please check if the application is generating telemetry data first. You can use
Console Exporterto just print your telemetry data in console first. Join our Slack Community if you need help on how to export your telemetry data in consoleYour SigNoz installation is not running or behind a firewall
Please double check if the pods in SigNoz installation are running fine.
docker psorkubectl get pods -n platformare your friends for this.
What Cloud Endpoint Should I Use?
The primary method for sending data to SigNoz Cloud is through OTLP exporters. You can either send the data directly from your application using the exporters available in SDKs/language agents or send the data to a collector agent, which batches/enriches telemetry and sends it to the Cloud.
My Collector Sends Data to SigNoz Cloud
Using gRPC Exporter
The endpoint should be ingest.{region}.signoz.cloud:443, where {region} should be replaced with in, us, or eu. Note that the exporter endpoint doesn't require a scheme for the gRPC exporter in the collector.
# Sample config with `us` region
exporters:
    otlp:
        endpoint: "ingest.us.signoz.cloud:443"
        tls:
            insecure: false
        headers:
            "signoz-ingestion-key": "<SIGNOZ_INGESTION_KEY>"
Using HTTP Exporter
The endpoint should be https://ingest.{region}.signoz.cloud:443, where {region} should be replaced with in, us, or eu. Note that the endpoint includes the scheme https for the HTTP exporter in the collector.
# Sample config with `us` region
exporters:
    otlphttp:
        endpoint: "https://ingest.us.signoz.cloud:443"
        tls:
            insecure: false
        headers:
            "signoz-ingestion-key": "<SIGNOZ_INGESTION_KEY>"
My Application Sends Data to SigNoz Cloud
The endpoint should be configured either with environment variables or in the SDK setup code.
Using Environment Variables
Using gRPC Exporter
Examples with us region
OTEL_EXPORTER_OTLP_PROTOCOL=grpc OTEL_EXPORTER_OTLP_ENDPOINT=https://ingest.us.signoz.cloud:443 OTEL_EXPORTER_OTLP_HEADERS=signoz-ingestion-key=<SIGNOZ_INGESTION_KEY>
Using HTTP Exporter
OTEL_EXPORTER_OTLP_PROTOCOL=http/protobuf OTEL_EXPORTER_OTLP_ENDPOINT=https://ingest.us.signoz.cloud:443 OTEL_EXPORTER_OTLP_HEADERS=signoz-ingestion-key=<SIGNOZ_INGESTION_KEY>
Configuring Endpoint in Code
Please refer to the agent documentation.
Sending Data from a Third-Party Service
The endpoint configuration here depends on the export protocol supported by the third-party service. They may support either gRPC, HTTP, or both. Generally, you will need to adjust the host and port. The host address should be ingest.{region}.signoz.cloud:443, where {region} should be replaced with in, us, or eu, and port 443 should be used.
